Source: Statistical Yearbook of Hungary 1997
I. Short Overview
of the present Situation
State Budget Deficit
Cutbacks in Local Government Subsidies, Social Security Funds and Social Welfare Expenses
Lower Wages in the Market Sector
Deteriorating Balance of Trade and Statistical Distortions
Balance of Payments
Employment
Education
Black Economy
Taxes and Prices
Customs Policy and Other Protective Measures
Hungary’s Worsening Competitive Position, with Energy Policy in Focus
The austerity measures introduced in 1995 have failed to accomplish the expected objectives but, at the same time, compelled Hungarian people to bear the burdens and find themselves in a difficult situation. It would be very important that the results overweigh these burdens. Stabilisation of the state budget and the balance of payments is important, but it is time that the society and the economy in practice are given priority.
The new government elected in 1998 has recognised the need of a new economic scheme that has social issues in focus and attempts to establish social balance as well as boost economic growth. Nevertheless, the 1999 state budget still fails to take advantage of all the opportunities of accomplishing the objectives of the new economic policy.
Our team has looked into the 1999 State Budget Bill (SBB) as part of the entire Hungarian economic policy, and considered real economic growth in the previous four years of government. We have compared the 1995, 1996 and 1997 real figures, the 1998 estimations as well as the projections of the SBB for 1999 to the real economic performance in 1994.
An Economic Stabilisation Programme called the "Bokros Package" (named after the Minister of Finance at that time) was launched in 1995 and was continued in 1996, 1997 and even in 1998 although government officials often said the opposite. There are signs of shifts in government proposals for 1999 but remarkable changes are yet to come.
The rate of inflation in the past few years was higher than the budget forecast; therefore the cutbacks in expenditure were even larger than projected in the budget. (The only exception was the year 1998.) Consequently, the State Budget Deficit (not including privatisation revenues) reads as follows:
Table 1
State Budget Deficit
current prices, billion HUF
1994 |
1995 |
1996 |
1997 |
1998 (estimated) |
1999 (projected) |
277 |
307 |
135 |
338 |
299 |
382 |
Adjusting the figures with the rate of inflation and calculating with 1998 prices, the improvement in the budget has been insignificant, especially when compared to the cutbacks of nearly HUF 7,000 billion. In other words, funds "have disappeared". (Hospital beds illustrate it best; their number has decreased without a single penny economised. What is more, several hospitals have gone or are close to being bankrupt.) At the same time, an overall deterioration can be seen in the society and its capability to function due to the large amounts cut down by the state.
Cutbacks in Local Government Subsidies, Social Security Funds and Social Welfare Expenses
We have analysed the following key components of the state budget at real value between 1994 and 1998 (the base year was 1994):
Tables 2 and 3
Cutbacks in Social Security Funds
current prices, billion HUF
Description |
1994 |
1995 |
1996 |
1997 |
1998 |
1995-1998 |
estimated |
projected |
accumulated |
||||
Pension Fund |
||||||
Total Expenses |
452.4 |
511.9 |
585.1 |
623.4 |
786.4 |
|
Change from Previous Year (%) |
113.2% |
114.3% |
106.5% |
126.1% |
||
Consumer Price * |
128.2% |
123.5% |
118.0% |
113.5% |
212.0% |
|
Difference from Consumer Price**** |
15.0% |
9.2% |
11.5% |
-12.6% |
||
Expenses at 1998 Prices |
959.3 |
846.7 |
783.6 |
707.6 |
786.4 |
|
Cutbacks at 1998 Prices |
-112.6 |
-175.7 |
-251.7 |
-172.9 |
-712.9 |
|
Expenses at 1994 Prices |
452.4 |
399.3 |
369.6 |
333.7 |
370.9 |
|
Cutbacks at 1994 Prices |
-53.1 |
-82.8 |
-118.7 |
-81.5 |
-336.2 |
|
Cutbacks at Current Prices |
68.1 |
131.5 |
220.0 |
173.6 |
||
Interest on Cutbacks*** |
10.3 |
36.7 |
71.3 |
96.8 |
215.2 |
|
Base of Interest |
78.4 |
246.6 |
537.9 |
862.8 |
||
Health Insurance Fund |
||||||
Total Expenses |
397.8 |
445.1 |
509.0 |
554.0 |
595.3 |
2103.4 |
Change from Previous Year (%) |
111.9% |
114.4% |
108.8% |
107.5% |
||
Consumer Price ** |
128.2% |
123.5% |
118.0% |
113.5% |
212.0% |
|
Difference from Consumer Price |
16.3% |
9.1% |
9.2% |
6.0% |
||
Expenses at 1998 Prices |
843.5 |
736.2 |
681.7 |
628.8 |
595.3 |
|
Cutbacks at 1998 Prices |
-107.3 |
-161.8 |
-214.7 |
-248.2 |
-732.1 |
|
Expenses at 1994 Prices |
397.8 |
347.2 |
321.5 |
296.5 |
280.7 |
|
Cutbacks at 1994 Prices |
-50.6 |
-76.3 |
-101.3 |
-117.1 |
-345.2 |
|
Cutbacks at Current Prices |
64.88 |
120.82 |
189.193 |
248.2244 |
||
Interest on Cutbacks*** |
9.8 |
34.4 |
64.9 |
94.3 |
203.4 |
|
Base of Interest |
74.7 |
229.9 |
484.1 |
*Prices of goods affecting pensioners the most were growing more dramatically than those of other products. (Prices of food and household energy grew by 31.1% and 50% respectively in
1995.)
**Prices of goods in close relation with the profile of the Health Insurance Fund were growing more dynamically. (Prices of medicine grew by 53.3% in 1995.)
***Real term rate of interest is 2%.
****The number of old-age pensioners grew by 1.6% in 1995, and a further 3.4% in 1996 compared to 1994.
Source: State Budget Bill of Hungary for the year 1998 (No. T/4832)
Table 4
Cutbacks in Local Government Expenses in Real Terms
current prices, billion HUF
Description |
1994 |
1995 |
1996 |
1997 |
1998 |
1995-1998 |
|
|
|
estimeted |
proposed |
accumulated |
|
Total Expenses |
762.9 |
817.4 |
940.2 |
1189.4 |
1175.5 |
|
Change from Previous Year (%) |
|
107.1% |
115.0% |
126.5% |
98.8% |
|
Price Index* |
|
127.8% |
123.1% |
118.5% |
113.5% |
211.6% |
Difference |
|
20.7% |
8.1% |
-8.0% |
14.7% |
141.6% |
Expenses at 1998 Prices |
1614.2 |
1353.3 |
1264.5 |
1350.0 |
1175.5 |
|
Cutbacks at 1998 Prices |
|
-260.9 |
-349.7 |
-264.3 |
-438.7 |
-1313.6 |
Expenses at 1994 Prices |
762.9 |
639.6 |
597.6 |
638.0 |
555.5 |
|
Cutbacks at 1994 Prices |
|
-123.3 |
-165.3 |
-124.9 |
-207.4 |
-620.8 |
Cutbacks at Current Prices |
|
157.6 |
260.0 |
232.8 |
438.7 |
|
Interest on Cutbacks*** |
|
23.5 |
78.1 |
153.7 |
174.4 |
429.6 |
Base of Interest |
|
181.1 |
519.2 |
905.7 |
|
|
Source: State Budget Bill of Hungary for the year 1998 (No. T/4832)
Table 5
State Subsidies Financed by Social Security
current prices, billion HUF
Description |
1994 |
1995 |
1996 |
1997 |
1998 |
1995-1998 |
estimated |
proposed |
accumulated |
||||
Total Expenses |
210.0 |
204.9 |
213.1 |
221.2 |
230.8 |
|
Change from Previous Year (%) |
97.6% |
104.0% |
103.8% |
104.3% |
||
Consumer Price * |
127.8% |
123.1% |
118.5% |
113.5% |
211.6% |
|
Difference from Consumer Price**** |
30.2% |
19.1% |
14.7% |
9.2% |
||
Expenses at 1998 Prices |
444.3 |
339.2 |
286.6 |
251.1 |
230.8 |
|
Cutbacks at 1998 Prices |
-105.1 |
-157.7 |
-193.3 |
-213.5 |
-669.7 |
|
Expenses at 1994 Prices |
210.0 |
160.3 |
135.5 |
118.7 |
109.1 |
|
Cutbacks at 1994 Prices |
-49.7 |
-74.5 |
-91.3 |
-100.9 |
-316.5 |
|
Cutbacks at Current Prices |
63.5 |
117.3 |
170.3 |
213.5 |
||
Interest on Cutbacks*** |
9.6 |
33.1 |
63.3 |
87.4 |
193.3 |
|
Base of Interest |
73.1 |
223.4 |
456.9 |
Source: State Budget Bill of Hungary for the year 1998 (No. T/4832)
Table 6
Cutbacks in State Budget Expenses of Governmental Organisations
in Real Terms
current prices, billion HUF
Description |
1994 |
1995 |
1996 |
1997 |
1998 |
1995-1998 |
|
|
|
estimated |
proposed |
accumulated |
|
Total Expenses |
612.6 |
612.7 |
720.8 |
908.4 |
961.5 |
|
Change from Previous Year (%) |
|
100.0% |
117.6% |
126.0% |
105.8% |
|
Price Index* |
|
127.8% |
123.1% |
118.5% |
113.5% |
211.6% |
Difference |
|
27.8% |
5.5% |
-7.5% |
7.7% |
141.6% |
Expenses at 1998 Prices |
1296.2 |
1014.4 |
969.5 |
1031.0 |
961.5 |
|
Cutbacks at 1998 Prices |
|
-281.8 |
-326.8 |
-265.2 |
-334.7 |
-1208.5 |
Expenses at 1994 Prices |
612.6 |
479.4 |
458.2 |
487.3 |
454.4 |
|
Cutbacks at 1994 Prices |
|
-133.2 |
-154.4 |
-125.3 |
-158.2 |
-571.1 |
Cutbacks at Current Prices |
|
170.2 |
243.0 |
233.6 |
120.7 |
|
Interest on Cutbacks*** |
|
25.4 |
79.6 |
153.5 |
149.7 |
408.1 |
Base of Interest |
|
195.6 |
518.1 |
905.2 |
|
|
Table 7 is a summary of figures in Tables 2, 3, 4, 5 and 6. It summarises the cutbacks, assumed interests and their totals.
Table 7
Summary Sheet of Cutbacks
(analysis of data from tables 2 – 6; using 1994 as the base year)
current prices, billion HUF
Description |
|
1995 |
1996 |
1997 |
1998 |
Total* |
Pension Fund |
principal |
68.1 |
131.5 |
220.0 |
173.6 |
712.9 |
(Table 2) |
interest |
10.3 |
36.7 |
71.3 |
96.8 |
215.1 |
|
TOTAL |
78.4 |
168.2 |
291.3 |
270.4 |
928.0 |
Health Insurance Fund |
principal |
64.9 |
120.8 |
189.2 |
248.2 |
732.1 |
(Table 3) |
interest |
9.8 |
34.4 |
64.9 |
94.3 |
203.4 |
|
TOTAL |
74.7 |
155.2 |
254.1 |
342.5 |
935.5 |
Local Governments |
principal |
157.6 |
260.0 |
232.8 |
438.7 |
1313.6 |
(Table 4) |
interest |
23.5 |
78.1 |
153.7 |
174.4 |
429.7 |
|
TOTAL |
181.1 |
338.1 |
386.5 |
613.1 |
1743.3 |
Social Welfare Expenses |
principal |
63.5 |
117.3 |
170.3 |
213.6 |
669.7 |
(Table 5) |
interest |
9.6 |
33.1 |
63.3 |
87.4 |
193.4 |
|
TOTAL |
73.1 |
150.4 |
233.6 |
301.0 |
863.1 |
Governmental Organisations |
principal |
170.2 |
243.0 |
233.6 |
120.7 |
1208.5 |
(Table 6) |
interest |
25.4 |
79.6 |
153.5 |
149.7 |
408.2 |
|
TOTAL |
195.6 |
322.6 |
387.1 |
270.4 |
1616.7 |
GRAND TOTAL |
|
|
|
|
|
|
of Tables 2-6 |
|
602.9 |
1134.5 |
1552.6 |
1797.4 |
6086.6 |
Exchange Rate |
HUF/USD |
125.69 |
152.57 |
186.75 |
214.45 |
|
Change in Balance |
|
|
|
|
|
|
Proportional to Cutbacks |
bn USD |
4.8 |
7.4 |
8.3 |
8.4 |
|
Balance of Trade |
|
|
|
|
|
|
in 1994 |
bn USD |
-3.9 |
-3.9 |
-3.9 |
-3.9 |
|
Expected Balance |
bn USD |
0.9 |
3.5 |
4.4 |
4.5 |
|
Out of Industrial Free Zones |
|
|
|
|
|
|
Actual Balance |
bn USD |
-2.6 |
-2.7 |
-3.0 |
-4.5 |
|
Difference between |
|
|
|
|
|
|
Actual and Expected Balance |
bn USD |
3.5 |
6.2 |
7.4 |
8.6 |
|
*at 1998 prices
The summary sheet contains cutbacks only in the five key components of the state budget because impacts of the austerity measures in other areas or in the entire society are difficult to measure. Cutbacks (calculating also with the interests) in the five components totalled over HUF 6,000 billion in 1998. Another 1,000 billion comes from lower wages in the market sector (see below), which ends up in a total amount of cutbacks worth HUF 7,000 billion. We have only estimates as to the losses for the entire society, which, we suppose to go up to HUF 10,000 billion.
Lower Wages in the Market Sector
In addition to cuts having direct impact on the budget (all components in Tables 2-6), wages of employees working in the market sector fell by HUF 130 billion in real terms in 1995. The downward tendency did not stop, and wages dropped by another HUF 184 billion in 1996. Wages in 1997 were HUF 181 billion less in real terms than in 1994. (1998 data are not available yet, but supposedly wages moved closer to the 1994 level, so no further wage cuts are estimated.) The amount totalled around HUF 1,000 billion at 1998 prices (see Table 8). However, the state budget saw only a modest improvement whereas the income of businesses is also much less than the HUF 7000 billion taken away from the society.
Table 8
Pre-tax Income and Labour Costs of Companies
billion HUF
Description |
1994 |
1995 |
1996 |
1997* |
Pre-tax Income - |
|
|
|
|
Total |
105.4 |
195.5 |
391.7 |
877.3 |
Not Including Financial Activities |
35.1 |
128.1 |
288.5 |
782.4 |
Financial Activities |
70.3 |
67.4 |
103.2 |
94.9 |
Producer Price |
1 |
1.289 |
1.218 |
1.204 |
Profits (at 1994 prices) |
105.4 |
151.7 |
249.5 |
464.1 |
Profit Increase (at 1994 prices) |
0.0 |
46.3 |
144.1 |
358.7 |
Wages Costs |
1320.6 |
1525.9 |
1798.7 |
2128.9 |
Consumer Price Change (%) |
1 |
1.282 |
1.235 |
1.18 |
Savings on Wages (at 1994 prices) |
0.0 |
130.4 |
184.5 |
181.1 |
Real Wages (1994 Wage Bill) |
1320.6 |
1190.2 |
1136.1 |
1139.5 |
|
|
|
||
Total (1997 structure) |
|
|
423.9 |
|
Consumer Price Base (multiplier) |
1 |
1.282 |
1.58327 |
1.868259 |
Producer Price Base (multiplier) |
1 |
1.289 |
1.570002 |
1.890282 |
Savings on Wages at 1998 prices |
0 |
276.4 |
391.3 |
384.0 |
Producer Price Index 1994=100 |
1 |
2.12 |
2.12 |
2.12 |
|
|
|||
Source: Hungarian Central Statistical Bureau
*A new structure of income calculations was introduced in 1997.
Savings on Wages at 1998 prices (supposing 0 in 1998) totals HUF 1,052 billion (USD 4.87 million at an exchange rat of 216 HUF/USD).
Deteriorating Balance of Trade and
Statistical Distortions
We have used customs statistics (not including industrial free zones) for calculating the balance of trade for several reasons.
– corporate tax amounts to 0.5% as compared to the generated value added by companies operating in free zones, whereas other companies have a ratio of 2.6%. (By the way, most of the value added leaves the country in the form of profits, so it is only a temporary and formal factor in increasing the GDP in Hungary.);
– the ratio can be expressed in term of tax relieves, which goes up to 10.1% for companies operating in free zones and only 3.4% for other companies;
– companies operating in the free zones receive considerable government subsidies;
– wages and related expenses represent 5.2% in companies operating in the free zones and 17.1% in other companies in Hungary. However, most of the state revenues comes from taxes and fees charged on wages, and also consumer taxes that are generated by spending those wages. Consequently, the relative contribution of companies operating in the free zones is fifteen times less than that of other companies.
(A more detailed analysis of the above can be found in a publication – 1997/7 - of the Economic Analysis and Information Institute of the Hungarian Central Statistical Bureau.)
Table 9a
Exports by Industrial Sector
broken down by industrial free zones
million USD
Description of Industry |
January – November 1997 |
January – November 1998. |
Variance (98–97)* |
||||||
Customs |
Free |
Total |
Customs |
Free |
Total |
Customs |
Free |
Total |
|
Agriculture and Game Farming |
713.3 |
0.1 |
713.4 |
785.4 |
785.4 |
72.1 |
-0.1 |
72.0 |
|
Forest Management |
66.8 |
66.8 |
66.9 |
66.9 |
0.1 |
0.0 |
0.1 |
||
Fishing |
5.3 |
5.3 |
6.8 |
6.8 |
1.5 |
0.0 |
1.5 |
||
Total Agriculture and Related Industries |
785.4 |
0.1 |
785.5 |
859.1 |
0.0 |
859.1 |
73.7 |
-0.1 |
73.6 |
Coal and Peat Mining |
1.3 |
1.3 |
0.5 |
0.5 |
-0.8 |
0.0 |
-0.8 |
||
Crude Oil and Natural Gas Mining |
0.0 |
1.6 |
1.6 |
1.6 |
0.0 |
1.6 |
|||
Uranium Ore Mining |
2.5 |
2.5 |
2.0 |
2.0 |
-0.5 |
0.0 |
-0.5 |
||
Metallic Ore Mining |
15.7 |
15.7 |
21.3 |
21.3 |
5.6 |
0.0 |
5.6 |
||
Other Mining |
10.1 |
10.1 |
9.7 |
9.7 |
-0.4 |
0.0 |
-0.4 |
||
Total Mining |
29.6 |
0.0 |
29.6 |
35.1 |
0.0 |
35.1 |
5.5 |
0.0 |
5.5 |
Food and Beverages Production |
1773.6 |
4.5 |
1778.1 |
1641.1 |
5.7 |
1646.8 |
-132.5 |
1.2 |
-131.3 |
Tobacco Production |
73.0 |
73.0 |
54.5 |
54.5 |
-18.5 |
0.0 |
-18.5 |
||
Total Food, Beverages, Tobacco |
1846.6 |
4.5 |
1851.1 |
1695.6 |
5.7 |
1701.3 |
-151.0 |
1.2 |
-149.8 |
Textile Processing |
398.5 |
29.6 |
428.1 |
486.8 |
37.0 |
523.8 |
88.3 |
7.4 |
95.7 |
Clothes Manufacturing |
906.5 |
28.4 |
934.9 |
963.1 |
68.0 |
1031.1 |
56.6 |
39.6 |
96.2 |
Leather and Footwear Manufacturing |
370.2 |
18.0 |
388.2 |
394.0 |
29.7 |
423.7 |
23.8 |
11.7 |
35.5 |
Wood Processing |
232.2 |
7.5 |
239.7 |
270.1 |
7.8 |
277.9 |
37.9 |
0.3 |
38.2 |
Paper Processing |
187.9 |
7.5 |
195.4 |
208.4 |
5.0 |
213.4 |
20.5 |
-2.5 |
18.0 |
Publishing and Printing |
44.9 |
0.1 |
45.0 |
50.8 |
0.4 |
51.2 |
5.9 |
0.3 |
6.2 |
Furniture and Related Industry |
317.4 |
93.4 |
410.8 |
349.2 |
128.2 |
477.4 |
31.8 |
34.8 |
66.6 |
Total Light Industry |
2457.6 |
184.5 |
2642.1 |
2722.4 |
276.1 |
2998.5 |
264.8 |
91.6 |
356.4 |
Crude Oil and Coke Production |
373.1 |
373.1 |
297.8 |
297.8 |
-75.3 |
0.0 |
-75.3 |
||
Chemical Materials and Products |
1364.7 |
16.1 |
1380.8 |
1355.4 |
96.0 |
1451.4 |
-9.3 |
79.9 |
70.6 |
Rubber and Plastics Production |
433.2 |
41.2 |
474.4 |
485.8 |
49.8 |
535.6 |
52.6 |
8.6 |
61.2 |
Total Chemical Industry |
2171.0 |
57.3 |
2228.3 |
2139.0 |
145.8 |
2284.8 |
-32.0 |
88.5 |
56.5 |
Non-Metallic Products |
291.6 |
19.5 |
311.1 |
331.5 |
21.1 |
352.6 |
39.9 |
1.6 |
41.5 |
Metallurgy |
820.7 |
26.5 |
847.2 |
858.4 |
7.3 |
865.7 |
37.7 |
-19.2 |
18.5 |
Fabricated Metal Products |
416.1 |
63.9 |
480.0 |
502.6 |
86.2 |
588.8 |
86.5 |
22.3 |
108.8 |
Machinery and Equipment |
972.4 |
153.9 |
1126.3 |
1098.5 |
201.8 |
1300.3 |
126.1 |
47.9 |
174.0 |
Computers and Office Automation |
143.1 |
1342.0 |
1485.1 |
105.4 |
2023.1 |
2128.5 |
-37.7 |
681.1 |
643.4 |
Electric Devices and Equipment |
1140.1 |
537.3 |
1677.4 |
1280.7 |
624.0 |
1904.7 |
140.6 |
86.7 |
227.3 |
Telecommunications Equipment |
487.9 |
830.7 |
1318.6 |
613.8 |
1243.0 |
1856.8 |
125.9 |
412.3 |
538.2 |
Measuring Instruments |
172.7 |
11.4 |
184.1 |
184.2 |
10.6 |
194.8 |
11.5 |
-0.8 |
10.7 |
Road Vehicle Manufacturing |
889.5 |
1264.8 |
2154.3 |
837.7 |
2659.7 |
3497.4 |
-51.8 |
1394.9 |
1343.1 |
Other Vehicle Manufacturing |
63.6 |
0.3 |
63.9 |
79.4 |
1.2 |
80.6 |
15.8 |
0.9 |
16.7 |
Total Machinery Manufacturing |
4285.4 |
4204.3 |
8489.7 |
4702.3 |
6849.6 |
11551.9 |
416.9 |
2645.3 |
3062.2 |
Electricity, Gas, Heating, Water |
85.1 |
85.1 |
89.0 |
89.0 |
3.9 |
0.0 |
3.9 |
||
Information Technology |
0.0 |
0.0 |
0.0 |
0.0 |
0.0 |
0.0 |
|||
Services Related to Business Activities |
0.0 |
0.0 |
0.0 |
0.0 |
0.0 |
0.0 |
|||
Leisure Time Activities, Sports |
0.0 |
6.9 |
6.9 |
6.9 |
0.0 |
6.9 |
|||
Grand Total |
12773.0 |
4496.7 |
17269.7 |
13439.3 |
7305.6 |
20744.9 |
666.3 |
2808.9 |
3475.2 |
of which: Manufacturing |
10026.3 |
4492.1 |
14518.4 |
10753.6 |
7299.9 |
18053.5 |
727.3 |
2807.8 |
3535.1 |
Food Industry |
2632 |
4.6 |
2636.6 |
2554.7 |
5.7 |
2560.4 |
-77.3 |
1.1 |
-76.2 |
* base figures from the months of January through September 1998 are deducted
Table 9b
Imports by Industrial Sector
broken down by industrial free zones
million USD
Description of Industry |
January – November 1997 |
January – November 1998 |
Variance (98–97)* |
||||||
Customs |
Free |
Total |
Customs |
Free |
Total |
Customs |
Free |
Total |
|
Agriculture and Game Farming |
339.9 |
0.3 |
340.2 |
365.5 |
365.5 |
25.6 |
-0.3 |
25.3 |
|
Forest Management |
13.4 |
0.8 |
14.2 |
18.2 |
18.2 |
4.8 |
-0.8 |
4.0 |
|
Fishing |
1.2 |
1.2 |
1.1 |
1.1 |
-0.1 |
0.0 |
-0.1 |
||
Total Agriculture and Related Industries |
354.5 |
1.1 |
355.6 |
384.8 |
0.0 |
384.8 |
30.3 |
-1.1 |
29.2 |
Coal and Peat Mining |
98.6 |
98.6 |
83.9 |
83.9 |
-14.7 |
0.0 |
-14.7 |
||
Crude Oil and Natural Gas Mining |
1389.7 |
1389.7 |
1168.2 |
1168.2 |
-221.5 |
0.0 |
-221.5 |
||
Uranium Ore Mining |
63.1 |
63.1 |
39.5 |
39.5 |
-23.6 |
0.0 |
-23.6 |
||
Metallic Ore Mining |
48.1 |
48.1 |
74.1 |
74.1 |
26.0 |
0.0 |
26.0 |
||
Other Mining |
53.0 |
0.1 |
53.1 |
51.0 |
0.1 |
51.1 |
-2.0 |
0.0 |
-2.0 |
Total Mining |
1652.5 |
0.1 |
1652.6 |
1416.7 |
0.1 |
1416.8 |
-235.8 |
0.0 |
-235.8 |
Food and Beverages Production |
701.6 |
9.9 |
711.5 |
792.3 |
9.9 |
802.2 |
90.7 |
0.0 |
90.7 |
Tobacco Production |
10.9 |
10.9 |
7.4 |
7.4 |
-3.5 |
0.0 |
-3.5 |
||
Total Food, Beverages, Tobacco |
712.5 |
9.9 |
722.4 |
799.7 |
9.9 |
809.6 |
87.2 |
0.0 |
87.2 |
Textile Processing |
920.3 |
73.5 |
993.8 |
1059.3 |
79.1 |
1138.4 |
139.0 |
5.6 |
144.6 |
Clothes Manufacturing |
301.4 |
5.5 |
306.9 |
318.3 |
21.4 |
339.7 |
16.9 |
15.9 |
32.8 |
Leather and Footwear Manufacturing |
384.0 |
16.4 |
400.4 |
403.3 |
29.6 |
432.9 |
19.3 |
13.2 |
32.5 |
Wood Processing |
165.9 |
7.6 |
173.5 |
202.1 |
5.2 |
207.3 |
36.2 |
-2.4 |
33.8 |
Paper Processing |
539.0 |
17.5 |
556.5 |
608.0 |
19.1 |
627.1 |
69.0 |
1.6 |
70.6 |
Publishing and Printing |
97.8 |
4.1 |
101.9 |
172.7 |
5.7 |
178.4 |
74.9 |
1.6 |
76.5 |
Furniture and Related Industry |
312.8 |
28.0 |
340.8 |
356.0 |
14.5 |
370.5 |
43.2 |
-13.5 |
29.7 |
Total Light Industry |
2721.2 |
152.6 |
2873.8 |
3119.7 |
174.6 |
3294.3 |
398.5 |
22.0 |
420.5 |
Crude Oil and Coke Production |
277.6 |
2.4 |
280.0 |
201.4 |
6.2 |
207.6 |
-76.2 |
3.8 |
-72.4 |
Chemical Materials and Products |
2071.7 |
113.8 |
2185.5 |
2257.8 |
329.3 |
2587.1 |
186.1 |
215.5 |
401.6 |
Rubber and Plastics Production |
628.4 |
145.8 |
774.2 |
731.1 |
214.3 |
945.4 |
102.7 |
68.5 |
171.2 |
Total Chemical Industry |
2977.7 |
262.0 |
3239.7 |
3190.3 |
549.8 |
3740.1 |
212.6 |
287.8 |
500.4 |
Non-Metallic Products |
316.8 |
5.7 |
322.5 |
393.1 |
14.8 |
407.9 |
76.3 |
9.1 |
85.4 |
Metallurgy |
1052.6 |
58.8 |
1111.4 |
1144.0 |
78.8 |
1222.8 |
91.4 |
20.0 |
111.4 |
Fabricated Metal Products |
493.2 |
117.8 |
611.0 |
615.2 |
187.0 |
802.2 |
122.0 |
69.2 |
191.2 |
Machinery and Equipment |
1551.9 |
367.7 |
1919.6 |
2013.1 |
665.3 |
2678.4 |
461.2 |
297.6 |
758.8 |
Computers and Office Automation |
513.3 |
613.1 |
1126.4 |
504.3 |
827.6 |
1331.9 |
-9.0 |
214.5 |
205.5 |
Electric Devices and Equipment |
747.7 |
364.0 |
1111.7 |
929.3 |
517.4 |
1446.7 |
181.6 |
153.4 |
335.0 |
Telecommunications Equipment |
879.6 |
905.6 |
1785.2 |
1129.0 |
1237.4 |
2366.4 |
249.4 |
331.8 |
581.2 |
Measuring Instruments |
333.3 |
45.8 |
379.1 |
393.7 |
61.0 |
454.7 |
60.4 |
15.2 |
75.6 |
Road Vehicle Manufacturing |
958.3 |
761.1 |
1719.4 |
1389.9 |
1332.8 |
2722.7 |
431.6 |
571.7 |
1003.3 |
Other Vehicle Manufacturing |
85.3 |
1.1 |
86.4 |
87.0 |
1.6 |
88.6 |
1.7 |
0.5 |
2.2 |
Total Machinery Manufacturing |
5562.6 |
3176.2 |
8738.8 |
7061.5 |
4830.1 |
11891.6 |
1498.9 |
1653.9 |
3152.8 |
Electricity, Gas, Heating, Water |
96.9 |
96.9 |
75.1 |
75.1 |
-21.8 |
0.0 |
-21.8 |
||
Information Technology |
0.0 |
0.0 |
0.0 |
0.0 |
0.0 |
0.0 |
|||
Services Related to Business Activities |
0.0 |
0.0 |
0.0 |
0.0 |
0.0 |
0.0 |
0.0 |
||
Leisure Time Activities, Sports |
0.0 |
7.1 |
7.1 |
7.1 |
0.0 |
7.1 |
|||
Grand Total |
15447.3 |
3666.4 |
19113.7 |
17592.0 |
5658.1 |
23250.1 |
2144.7 |
1991.7 |
4136.4 |
of which: Manufacturing |
12630.9 |
3655.3 |
16286.2 |
14908.6 |
5648.1 |
20556.7 |
2277.7 |
1992.8 |
4270.5 |
Food Industry |
1067.0 |
11.0 |
1078.0 |
1184.5 |
9.9 |
1194.4 |
117.5 |
-1.1 |
116.4 |
* base figures from the months of January through September 1998 are deducted
Table 9c
Balance of Trade by Industrial Sectors
broken down by industrial free zones
million USD
Description of Industry |
January – November 1997 |
January – November 1998 |
Variance (98–97)* |
||||||
Customs |
Free |
Total |
Customs |
Free |
Total |
Customs |
Free |
Total |
|
Agriculture and Game Farming |
373.4 |
-0.2 |
373.2 |
419.9 |
0.0 |
419.9 |
46.5 |
0.2 |
46.7 |
Forest Management |
53.4 |
-0.8 |
52.6 |
48.7 |
0.0 |
48.7 |
-4.7 |
0.8 |
-3.9 |
Fishing |
4.1 |
0.0 |
4.1 |
5.7 |
0.0 |
5.7 |
1.6 |
0.0 |
1.6 |
Total Agriculture and Related Industries |
430.9 |
-1.0 |
429.9 |
474.3 |
0.0 |
474.3 |
43.4 |
1.0 |
44.4 |
Coal and Peat Mining |
-97.3 |
0.0 |
-97.3 |
-83.4 |
0.0 |
-83.4 |
13.9 |
0.0 |
13.9 |
Crude Oil and Natural Gas Mining |
-1389.7 |
0.0 |
-1389.7 |
-1166.6 |
0.0 |
-1166.6 |
223.1 |
0.0 |
223.1 |
Uranium Ore Mining |
-60.6 |
0.0 |
-60.6 |
-37.5 |
0.0 |
-37.5 |
23.1 |
0.0 |
23.1 |
Metallic Ore Mining |
-32.4 |
0.0 |
-32.4 |
-52.8 |
0.0 |
-52.8 |
-20.4 |
0.0 |
-20.4 |
Other Mining |
-42.9 |
-0.1 |
-43.0 |
-41.3 |
-0.1 |
-41.4 |
1.6 |
0.0 |
1.6 |
Total Mining |
-1622.9 |
-0.1 |
-1623.0 |
-1381.6 |
-0.1 |
-1381.7 |
241.3 |
0.0 |
241.3 |
Food and Beverages Production |
1072.0 |
-5.4 |
1066.6 |
848.8 |
-4.2 |
844.6 |
-223.2 |
1.2 |
-222.0 |
Tobacco Production |
62.1 |
0.0 |
62.1 |
47.1 |
0.0 |
47.1 |
-15.0 |
0.0 |
-15.0 |
Total Food, Beverages, Tobacco |
1134.1 |
-5.4 |
1128.7 |
895.9 |
-4.2 |
891.7 |
-238.2 |
1.2 |
-237.0 |
Textile Processing |
-521.8 |
-43.9 |
-565.7 |
-572.5 |
-42.1 |
-614.6 |
-50.7 |
1.8 |
-48.9 |
Clothes Manufacturing |
605.1 |
22.9 |
628.0 |
644.8 |
46.6 |
691.4 |
39.7 |
23.7 |
63.4 |
Leather and Footwear Manufacturing |
-13.8 |
1.6 |
-12.2 |
-9.3 |
0.1 |
-9.2 |
4.5 |
-1.5 |
3.0 |
Wood Processing |
66.3 |
-0.1 |
66.2 |
68.0 |
2.6 |
70.6 |
1.7 |
2.7 |
4.4 |
Paper Processing |
-351.1 |
-10.0 |
-361.1 |
-399.6 |
-14.1 |
-413.7 |
-48.5 |
-4.1 |
-52.6 |
Publishing and Printing |
-52.9 |
-4.0 |
-56.9 |
-121.9 |
-5.3 |
-127.2 |
-69.0 |
-1.3 |
-70.3 |
Furniture and Related Industry |
4.6 |
65.4 |
70.0 |
-6.8 |
113.7 |
106.9 |
-11.4 |
48.3 |
36.9 |
Total Light Industry |
-263.6 |
31.9 |
-231.7 |
-397.3 |
101.5 |
-295.8 |
-133.7 |
69.6 |
-64.1 |
Crude Oil and Coke Production |
95.5 |
-2.4 |
93.1 |
96.4 |
-6.2 |
90.2 |
0.9 |
-3.8 |
-2.9 |
Chemical Materials and Products |
-707.0 |
-97.7 |
-804.7 |
-902.4 |
-233.3 |
-1135.7 |
-195.4 |
-135.6 |
-331.0 |
Rubber and Plastics Production |
-195.2 |
-104.6 |
-299.8 |
-245.3 |
-164.5 |
-409.8 |
-50.1 |
-59.9 |
-110.0 |
Total Chemical Industry |
-806.7 |
-204.7 |
-1011.4 |
-1051.3 |
-404.0 |
-1455.3 |
-244.6 |
-199.3 |
-443.9 |
Non-Metallic Products |
-25.2 |
13.8 |
-11.4 |
-61.6 |
6.3 |
-55.3 |
-36.4 |
-7.5 |
-43.9 |
Metallurgy |
-231.9 |
-32.3 |
-264.2 |
-285.6 |
-71.5 |
-357.1 |
-53.7 |
-39.2 |
-92.9 |
Fabricated Metal Products |
-77.1 |
-53.9 |
-131.0 |
-112.6 |
-100.8 |
-213.4 |
-35.5 |
-46.9 |
-82.4 |
Machinery and Equipment |
-579.5 |
-213.8 |
-793.3 |
-914.6 |
-463.5 |
-1378.1 |
-335.1 |
-249.7 |
-584.8 |
Computers and Office Automation |
-370.2 |
728.9 |
358.7 |
-398.9 |
1195.5 |
796.6 |
-28.7 |
466.6 |
437.9 |
Electric Devices and Equipment |
392.4 |
173.3 |
565.7 |
351.4 |
106.6 |
458.0 |
-41.0 |
-66.7 |
-107.7 |
Telecommunications Equipment |
-391.7 |
-74.9 |
-466.6 |
-515.2 |
5.6 |
-509.6 |
-123.5 |
80.5 |
-43.0 |
Measuring Instruments |
-160.6 |
-34.4 |
-195.0 |
-209.5 |
-50.4 |
-259.9 |
-48.9 |
-16.0 |
-64.9 |
Road Vehicle Manufacturing |
-68.8 |
503.7 |
434.9 |
-552.2 |
1326.9 |
774.7 |
-483.4 |
823.2 |
339.8 |
Other Vehicle Manufacturing |
-21.7 |
-0.8 |
-22.5 |
-7.6 |
-0.4 |
-8.0 |
14.1 |
0.4 |
14.5 |
Total Machinery Manufacturing |
-1277.2 |
1028.1 |
-249.1 |
-2359.2 |
2019.5 |
-339.7 |
-1082.0 |
991.4 |
-90.6 |
Electricity, Gas, Heating, Water |
-11.8 |
0.0 |
-11.8 |
13.9 |
0.0 |
13.9 |
25.7 |
0.0 |
25.7 |
Information Technology |
0.0 |
0.0 |
0.0 |
0.0 |
0.0 |
0.0 |
0.0 |
0.0 |
0.0 |
Services Related to Business Activities |
0.0 |
0.0 |
0.0 |
0.0 |
0.0 |
0.0 |
0.0 |
0.0 |
0.0 |
Leisure Time Activities, Sports |
0.0 |
0.0 |
0.0 |
-0.2 |
0.0 |
-0.2 |
-0.2 |
0.0 |
-0.2 |
Grand Total |
-2674.3 |
830.3 |
-1844.0 |
-4152.7 |
1647.5 |
-2505.2 |
-1478.4 |
817.2 |
-661.2 |
of which: Manufacturing |
-2604.6 |
836.8 |
-1767.8 |
-4155.0 |
1651.8 |
-2503.2 |
-1550.4 |
815.0 |
-735.4 |
Food Industry |
1565.0 |
-6.4 |
1558.6 |
1370.2 |
-4.2 |
1366.0 |
-194.8 |
2.2 |
-192.6 |
Chapters above discuss the details of the cutbacks worth HUF 6,000 billion in the state sector between 1995 and 1998 (using 1994 as the base year and at 1998 prices). Supposing all the cutbacks had been moved into the balance of trade to improve it, it would have shown a surplus of USD 4.4 billion (HUF 950 billion) in 1998. Additionally, wages worth HUF 1,050 billion were "saved" a result of the austerity measures during the same period (also using 1994 as the base year and at 1998 prices). The amount would have improved the balance of trade by USD 4.5 billion in 1998.
On the other hand, customs statistics (not including free zones) estimate a deficit of USD 4.5 billion for 1998. The balance shows a trade deficit of USD 2.7 billion even after including free zones into the estimates (see Table 10). The deficit in real terms must be higher due to the drop in energy prices and variations in the cross currency rates.
Table 10
Volume of Trade by Free Zones and Customs Statistics
million USD
Description |
Exports |
% of Change |
Variance |
||||
1994 |
1995 |
1996 |
1997 |
1998 |
98/97 % |
m USD |
|
Customs Statistics |
10700.8 |
12867.0 |
12858.6 |
14065.8 |
14733.1 |
104.7% |
667.3 |
Industrial Free Zones |
0 |
1613.0 |
2845.1 |
5034.1 |
8272.2 |
164.3% |
3238.1 |
Total – m USD |
10700.8 |
14480.0 |
15703.7 |
19099.9 |
23005.3 |
120.4% |
3905.4 |
bn HUF |
1128.7 |
1825.3 |
2392.3 |
3566.8 |
4934.5 |
138.3% |
1367.7 |
of which Free Zones |
0 |
202.7 |
433.2 |
945.5 |
1777.9 |
188.0% |
832.4 |
|
Imports |
|
|
||||
Customs Statistics |
14553.8 |
15466.3 |
15617.0 |
17032.2 |
19235.8 |
112.9% |
2203.6 |
Industrial Free Zones |
0 |
1287.0 |
2526.7 |
4201.8 |
6470.6 |
154.0% |
2268.8 |
Total – m USD |
14553.8 |
16753.3 |
18143.7 |
21234.0 |
25706.4 |
121.1% |
4472.4 |
bn HUF |
1537 |
2111.9 |
2763.9 |
3961.2 |
5511.5 |
139.1% |
1550.3 |
of which Free Zones |
0 |
161.8 |
384.9 |
790.8 |
1390.1 |
175.8% |
599.3 |
|
Balance |
|
|
||||
Customs Statistics |
-3853.0 |
-2599.3 |
-2758.4 |
-2966.4 |
-4502.7 |
151.8% |
-1536.3 |
Industrial Free Zones |
0.0 |
326.0 |
318.4 |
832.3 |
1801.6 |
216.5% |
969.3 |
Total – m USD |
-3853.0 |
-2273.3 |
-2440.0 |
-2134.1 |
-2701.1 |
126.6% |
-567.0 |
bn HUF |
-408.3 |
-286.6 |
-371.6 |
-394.4 |
-577.0 |
146.3% |
-182.6 |
of which Free Zones |
0.0 |
40.9 |
48.3 |
154.7 |
387.8 |
250.7% |
233.1 |
Source: Exports-Imports Statistics, preliminary estimates for 1998
Table 10 illustrates the expected improvement in the balance of trade from the cutbacks and the actual balance (both at the official exchange rates). Table 11 gives an outline of the balance over the past five years within the customs boundaries (that is excluding free zones) of Hungary in USD, DEM and ECU. It provides a clear picture of the real deterioration of the trade balance since it eliminates variations in cross currency rates that distort the picture expressed in one currency only. Further distortions come from prices of imported energy that fell radically in 1998, and the volume of imports that expanded, increasing the deficit by USD 500 million. All in all, the trade deficit went up from USD 2.5 billion in 1995 to 4.5 billion in 1998. However, in real terms (i.e. after adjustments are made to reflect the drop in energy prices and variations in the cross currency rates) the deficit is around USD 6 billion.
Table 11
Balance of Trade within Customs Boundaries of Hungary
(not including free zones)
Period |
million |
exchange rate |
million |
exchange rate |
million |
USD |
USD/DEM |
DEM |
USD/ECU |
ECU |
|
1994 |
-3853.0 |
1.616 |
-6228.0 |
0.843 |
-3246.24 |
1995 |
-2599.3 |
1.431 |
-3719.3 |
0.773 |
-2008.64 |
1996 |
-2758.4 |
1.505 |
-4150.4 |
0.798 |
-2201.67 |
1997 |
-2966.3 |
1.734 |
-5144.5 |
0.885 |
-2626.26 |
1998 |
-4502.7 |
1.756 |
-7905.1 |
0.890 |
-4006.99 |
1998 (adjusted) |
-5002.7 |
1.756 |
-8782.9 |
0.890 |
-4451.94 |
The last line of Table 11 is adjusted to make it comparable to data from 1997. The adjustment is necessary to offset the impacts of
energy imports: 1) the huge drop in prices, and 2) an increase of imported volumes by 40 PJ, which total over USD 500 million.
Variations in cross currency rates also distort the picture. The bulk of exports and imports in Hungary are done with countries linked to the exchange rate of the ECU, but the trade turnover is still computed in US dollars. (Of course, once statistics are made in Euros, the impact of cross rates will become less significant.) The impact between 1997 and 1998 is 1.3%, or a few hundred million dollars in the balance of trade. However, it becomes more substantial, 22.7% between 1995 and 1998, which ends up in a deficit growth expressed in billions of dollars. It is major enough to be included in all reasonable calculations and analyses, even if it causes worry and inconvenience.
It is important to devote a few words to trade statistics and their compliance to EU standards. Statistical methods and tools as a whole have been adjusted to meet EU requirements, with the exception of foreign trade where industrial free zones were included among data files in January 1997. The Hungarian government has expressed its ambition to sustain free zones even after joining the EU for another year at least.
The impact of cross currency rate variations may take some people by surprise but it will, by all means, become evident when Hungary starts to keep records of statistics in Euros instead of US dollars.
The above figures support our conclusion that the austerity measures hardly had any impact on the balance of trade. (Additional customs duties, introduced at the same time, had reducing imports.)
The austerity measures have not affected the operations of industrial free zones, which is another reason to exclude them from trade balance calculations. Including industrial free zones into the statistics of trade within the customs boundaries makes statistics less clear and unreliable. Kopint Datorg (an economic research firm) published a study discussing the state of the economy in 1998 saying: "It is important to note that since 1997 trade statistics have included free zones but ignored trade between the free zones and the area within the customs boundaries. Since then no information has been available about the contribution of areas within the customs boundaries to the exports of the free zones, and further processing or use of products within the customs boundaries." Unofficial but reliable calculations reveal that the amount could reach USD 100 million or so a year.
The austerity measures have hit the lower tenths of the population the hardest. (Note: consumers / households are divided into ten groups when statistics are compiled on the use of income.) At the same time, the lower tenths primarily consume domestic products, whereas the higher income the households have, the higher is the share of imported goods in the consumption. The austerity measures hit mostly the lower tenths of the population (e.g. those who have lost income from lower child care benefits or pension) therefore the consumption of the domestic goods decreased. The higher tenths earn more money (especially in the market sector) that they spend on imported goods as well, which, hand in hand with the impacts of abolishing and/or shrinking customs duties, boosts imports.
Data included in the balance of payments are not entirely reliable for various reasons. State, local governmental and even private property of immense value has been sold chiefly to foreign owners. Foreign exchange revenues from the sales of property improve the balance of payments, but at the same time, distort it since such revenues are only generated once. Consequently, the balance of payments needs to be adjusted by revenues worth USD 10 billion for the period between 1992 (the year of first sales) and today. The Central Statistical Office has not provided complete data about the sales even in retrospect; as a rule they publish data with at least two or three years’ delay. Recent estimations say foreigners have purchased large areas of private land in the West of Hungary, although laws prohibit selling land to foreign owners. The National Bank of Hungary (NBH) must be aware of the prices of those transactions, i.e. USD 1 billion, for most of that amount was converted into forints. Some of the foreign currency received have "vanished". It should also be noted that sales of property, by its nature, is not recurring, and revenues from the sales will not improve the balance in the coming years. (Politicians tend to highlight only the benefits of those revenues.)
Net foreign exchange revenues from tourism have surged over recent years although its real performance (expressed in nights spent in Hungary) has been stagnant. The reason for the increase is found in the series of measures by banks to reduce real interest rates on foreign exchange and give premium interest rates on the national currency. It ends up in higher interest burdens in the state budget, financed, of course, by Hungarian taxpayers. Another adverse impact of the measures is that they attract "hot" money from dubious foreign sources, seemingly creating a balance. (Real, though temporary, revenues stem from the decrease in foreign currency retail savings in real terms, which will be reflected in a relative drop in foreign exchange revenues in a few years.)
The balance of payments may deteriorate for various reasons.
Deficit of trading within the customs boundaries of Hungary are offset by uncertain, speculative foreign exchange funds that are attracted by high interests (settled in the national currency at an annual 6% interest rate in real terms). By cutting high rates of interests, Hungary may run the risk of losing foreign investment because investors are only willing to stay if their assumed risks are compensated by higher returns from interest rates. They provoke turmoil to reflect the long-lasting international economic recession in the Hungarian environment, which is best manifested in fluctuations of the Budapest Stock Exchange. Another aggravating factor is the repatriation of profits generated by investments in Hungary, directly and indirectly promoted by allowances and subsidies granted by the government. A warning signal is that the amount of profits leaving the country doubled in 1998 as compared to 1997.
Hungary tops the list of direct foreign investment in developing countries in relative and absolute terms as well (see Table 50). This position suggests that the current pace of investments is likely to slow down in the future.
Hungary’s monetary policy has failed to observe international standards when it directed various funds (such as pension funds) to purchase government bonds. First of all, the way it is done today cannot last long. Second, the money invested in those funds may leave the country with slight chances of ever coming back, which puts deposit-holders and investors into an uncertain position. The only way savings can be kept in Hungary is to increase interest rates on forint deposits, which, in turn, destroys the balance of the state budget and payments. Estimates about projected sources of pension funds stand as perfect examples. And there is a further risk that funds actually raised will well exceed projected figures.
Financial crisis in developed economies has adverse impacts on Hungary’s economic policy very much focused on the fiscal, monetary aspects. The crisis may jeopardise its feasibility and sustainability. Therefore, and for other good reasons, a new, more beneficial economic policy needs to be implemented that shifts from fiscal aspects to real economic improvement. Our proposals are meant to serve that purpose.
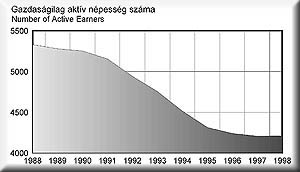
Because of the so-called Bokros package the standard of living was worsening not only because of the decline of wages in real terms, but also because of decreasing employment figures: official statistics reveal that 155 thousand jobs ceased in 1995, another 100 thousand in 1996 and a further 100 thousand in 1997. This added another HUF 103 billion (at 1996 prices) to the state budget deficit by the end of 1996 because:
The total loss of 355 thousand jobs over a relatively short three-year period is a torture not only for the individuals who lose their jobs but also for the entire economy.
Figure 1
Number of Active Earners
1988 – 1997
Source: Statistical Yearbook of Hungary 1997
Underemployment in 1997 went down to a critical value that itself slowed down the rate of losing jobs. However, another 100 thousand jobs ceased that year. The government had the pressing task to stop further increase of unemployment, or rather create new opportunities of employment. The rate of employment did not show spectacular improvement in 1998 either; there was a temporary increase but insignificant for statistical purposes. The methods used for compiling statistics is also questionable; those who earn some money for even 1 hour work during the week observed are regarded "employed" by the statistics. A further distortion comes from poor registration of around 50 thousand foreign residents (mostly running their own businesses) whose income is exceptionally high as a rule and may lead to miscalculations of average salaries and wages.
Official statistics and statements tend to mix up the rate of employment with that of unemployment. Table 12 is meant to clarify the difference and show the actual weight of the problem; it illustrates employment and unemployment rates in Hungary and developed countries of the world.
Table 12
Rate of Employment and Unemployment in Selected Countries and Regions
Country / Region |
Rate of Employment |
Rate of Unemployment (%) |
||||
Male |
Female |
Total |
Male |
Female |
Total |
|
Hungary |
60.4 |
42.8 |
51.2 |
9.5 |
7.7 |
8.7 |
EU |
70.6 |
50.5 |
60.5 |
9.5 |
12.4 |
10.8 |
USA |
80.8 |
67.5 |
74.0 |
4.9 |
5.1 |
5.0 |
Japan |
88.5 |
60.7 |
74.7 |
3.5 |
3.6 |
3.5 |
Source: Statistical Yearbook of Hungary, 1997 – data on Hungary,
Employment Rates Report 1998, Commission of the European Communities – data on the EU, USA and Japan.
Table 12 shows that though official unemployment figures are better in Hungary than in the EU, the rate of employment suggests that Hungary is far behind the EU. (In some instances jobless people are not registered at all because they stand no chances to get a job.) The nominal value and the rate of latent unemployment, not included in the statistics, have recently swelled but it did not prevent reports (e.g. reports of the Ministry of Finance) from concluding that unemployment rates and ratios are better than those of EU countries.
EU countries have launched a well-prepared, unified scheme to increase the number of available jobs and combat unemployment. (Appendix 1 gives an outline of employment concepts for 1999 in the EU.) Hungary should also adopt the scheme and implement measures complying with it, which would facilitate Hungary’s EU membership. Or, as matters stand now, the low rates of employment may impair Hungary’s ability to join the EU that will fear that jobless Hungarians will seek job opportunities in other countries of Europe.
Hungary is an open economy and getting even more open as a consequence of lower customs duties. Imports from the EU can get easy access into Hungary, which may jeopardise existing jobs in the country, or leave only opportunities to do the very simple work for low wages, deteriorating earnings. It can only be avoided if a scheme (even more effective than in the EU) is introduced to increase the rate of employment. Research and development should be given priority in the scheme for R&D is the engine that pulls the economy ahead by its positive multiplicator effect and usefulness for the entire society.
The issue of employment has been given priority even in countries where the number of active earners is higher than in Hungary.
Low rates of employment involve several problems to be solved.
In conclusion, employment problems and measures to eliminate them in the EU suggest that steps should be taken to open up new job opportunities (several hundreds of thousands) in Hungary as well, or else Hungary’s EU membership may be in peril.
Links between employment and education are obvious and strong. The need for well-qualified labour force is already immense, and is getting even more so in the future. The share of well-qualified professionals increases each year by 3.1, 2 and 2.5% in Canada, Japan and Germany respectively. Detailed surveys conclude that industries that invest the most into scientific research and apply new methods among the first ones are rich in human resources and improve their performance and competitive position by using the expertise and innovations. Products with high "intellectual content" are in demand in the international market while material-intensive goods are losing their value. Those trends in developed countries could serve as a lesson to learn from in less developed countries as well in terms of education and employment policies. (See Table 13.)
Table 13
Employment by Qualifications
(average annual rate of increase)
Country |
Period |
High Qualifications1 |
Low Qualifications |
|
Employees |
||||
Canada |
1981-1991 |
3.10 |
0.65 |
|
Japan |
1980-1990 |
2.90 |
0.60 |
|
USA |
1983-1993 |
2.60 |
1.40 |
|
Germany2 |
1980-1990 |
2.55 |
-0.01 |
|
France |
1982-1990 |
2.20 |
-0.55 |
|
Italy |
1981-1991 |
2.05 |
1.17 |
|
Source: OECD (STI/EAS Division), quoted by OMFB–MTA Világgazdasági Kutató Intézet (Economic Research Institute)
1 High qualifications include:
ISCO-88 Group I – legislators, senior associates, and managers;
ISCO-88 Group II – qualified employees;
ISCO-88 Group III – technicians and teachers.
2 In Germany ISCO-88 Group I does not include managers and ISCO-88 Group III does not include teachers; therefore high qualifications are underestimated in the table for Germany.
Key deficiencies of the employment policy in Hungary over the past few years have been its financial focus and the lack of selectivity, which have led to a radical cutback in the number of jobs in education, for instance. In 1994, the total number of staff employed in education was 336,800 while in September 1998, it was only 225,200, representing a reduction by 113,000, i.e. one third. Austerity measures have hit education the hardest: real wages went down dramatically, which necessarily affects the quality of education. Some say financial considerations must be present in education, which, unfortunately, may prove to end up in lower quality standards. Other countries thinking in the long run are improving education to make it one of the leading and most profitable sectors in the future. In Canada, education is given priority and 21 thousand new jobs were opened in 1995. Education and training is getting more important in Great Britain and France as well. The US exported education and training facilities and services of USD 7 billion in 1995. (Source: Hungarian daily Világgazdaság, 18 February 1999.)
Growing unemployment has been further aggravated by the state budget reform initiated by the government but not yet legally adopted since both interest groups and the parliament have been against it in its present form. The costs of more and more welfare services are charged directly to people who have already paid for them some ways, and at the same time, state support has been significantly cut. As a consequence, the quality of life in Hungary has deteriorated, which is not reflected in the official statistics. Savings do not come from the pockets of the obedient public, rather from the growing black and grey economy.
The economic boom, started in 1994, stopped up until 1997, and investment fell. Although new shopping centres have been erected all over the country, they do not contribute to economic development for most of them fail to bring the expected benefits, or even do more harm by putting retailers into a disastrous situation and damaging the surrounding environment. (Appendix 8 has more details about shopping centres.) Industrial output (without the energy sector) has also dropped temporarily. The stagnation and the slight decline of the economy can explain the bulk of the improvement of the external balance of payments. Therefore, most of the austerity measures have not been justified or necessary at all, and re-allocated income has only been passed on to the black economy and the foreign money laundry. The harmful effects of the "Bokros Package" on the entire economy are also reflected by worsening ratios: terms of trade improved by over 2% both in 1993 and 1994, however, it fell to 1% in 1995 and further 2 percentage points in 1996 (using customs statistics).
Consequently, trade deficit is basically unchanged despite the fact that austerity measures damaged economic performance and the state of the society. (Note: part of the deficit in 1995 comes from imports accelerated before the introduction of additional customs duties could take effect.) Trade deficit has started to grow since 1997 and it has been accelerated in 1998.
Measures against the expanding black economy were introduced early 1997. The police, customs authorities and legislation were designated for the purpose. However, the lack of specific proposals and figures (even in the 1998 State Budget Act), poor enforcement of existing laws and hesitation in implementing more severe legislation have prevented the fight against the black economy being successful. Improvement is hardly seen in the everyday life.
Economic growth started in 1997, but it is questionable how real and sustainable that growth is today. Dynamic, though superficial, expansion can only be seen in the output and exports of industrial free zones that are isolated from the economy as a whole.
Recent years have seen changes in the taxation and pricing systems, and that change has reinforced the old-fashioned and wasteful structure of the Hungarian economy. Real prices of electric energy and natural gas for industrial use dropped by roughly 20% between late 1991 and 1997. Prices of energy for industrial users expressed in US dollars as of October 1997 are not more than 80% of those charged in November 1991 even after several price rises in the national currency. Whereas energy prices (also in US dollars) for household use doubled in that period.
However high they seem, prices of motor vehicle fuels have also moved down in real terms over the previous years because the rate of increasing the consumer tax imposed on fuels have been lower than the rate of inflation year by year. Subsequent state budget revenues have also dropped in real terms (see Table 14). Costs of labour, on the other hand, have increased considerably between 1991 and 1997. Job opportunities have shrunk by 1.1 million since 1989 whereas the total sum of taxes and other charges (personal income tax, social security tax) have not seen any change; employees are more heavily hit by taxes than before (see Table 15). This must be especially true of people on payroll and even "truer" of state employees, who earn their living without additional sources of income and are unable to hide income from tax authorities. Real income of state employees went down by 50% between 1990 and 1997.
Table 14
State Revenues from Labour Taxes, Excise Duties, Consumer
and Other Types of Taxes
current prices, billion HUF
Description of Tax |
1988 |
1994 |
1995 |
1996 |
1997 |
1998 |
1999 |
|
|
|
|
|
estimated |
projected |
|
Personal Income Tax |
61.7 |
304.8 |
383.7 |
490.7 |
560.2 |
658.0 |
730.2 |
Social Security and Health Insurance Tax |
194.7 |
645.8 |
718.7 |
809.4 |
1016.5 |
1201.4 |
1260.7 |
Taxes Directly Charged on Wages |
256.4 |
950.6 |
1102.4 |
1300.1 |
1576.7 |
1859.4 |
1990.9 |
Total Tax Revenues |
599.5 |
1742.3 |
2151.3 |
2531.7 |
3000.0 |
3523.6 |
3934.2 |
Taxes Charged on Wages / Total Taxes |
42.8% |
54.6% |
51.2% |
51.4% |
52.6% |
52.8% |
50.6% |
Total State Budget Revenues |
898.2 |
3060.2 |
3614.5 |
4315.5 |
4571.8 |
5515.4 |
6070.1 |
Taxes Charged on Wages / Total Revenues |
28.5% |
31.1% |
30.5% |
30.1% |
34.5% |
33.7% |
32.8% |
Employees on Payroll (in thousands) |
5317.8 |
3881.8 |
3793.2 |
3743.7 |
3738.0 |
3747.0 |
3747.0 |
Per Capita Tax |
48215 |
244886 |
290625 |
347277 |
421803 |
496237 |
531332 |
Change in Tax |
100% |
508% |
603% |
720% |
875% |
1029% |
1102% |
Consumer Taxes |
87.5 |
164.3 |
200.9 |
222.1 |
267.5 |
310.0 |
363.0 |
Rate of Increase of Consumer Taxes |
100% |
188% |
230% |
254% |
306% |
354% |
415% |
Change in Consumer Prices |
100% |
365% |
468% |
578% |
683% |
781% |
859% |
Source: Statistical Yearbook and Monthly Statistical Bulletins; Ministry of Finance – Memorandum for the Bill No. T/276
Table 15
State Revenues from Labour and Income Taxes
current prices, billion HUF
Description of Tax |
1988 |
1994 |
1995 |
1996 |
1997 |
1998 |
1999 |
|
|
|
|
|
estimated |
projected |
|
Personal Income Tax |
61.7 |
304.8 |
383.7 |
490.7 |
560.2 |
658.0 |
730.2 |
Social Security and Health Insurance Tax |
194.7 |
645.8 |
718.7 |
809.4 |
1016.5 |
1201.4 |
1260.7 |
Taxes Directly Charged on Wages |
256.4 |
950.6 |
1102.4 |
1300.1 |
1576.7 |
1859.4 |
1990.9 |
Total Tax Revenues |
599.5 |
1742.3 |
2151.3 |
2531.7 |
3000.0 |
3523.6 |
3934.2 |
Taxes Charged on Wages / Total Taxes |
42.8% |
54.6% |
51.2% |
51.4% |
52.6% |
52.8% |
50.6% |
State Budget Revenues |
898.2 |
3060.2 |
3614.5 |
4315.5 |
4571.8 |
5515.4 |
6070.1 |
Taxes Charged on Wages / Total Revenues |
28.5% |
31.1% |
30.5% |
30.1% |
34.5% |
33.7% |
32.8% |
Employees on Payroll (in thousands) |
5317.8 |
3881.8 |
3793.2 |
3743.7 |
3738.0 |
3747.0 |
3747.0 |
Per Capita Tax |
48215 |
244886 |
290625 |
347277 |
421803 |
496237 |
531332 |
Change in Tax |
100% |
508% |
603% |
720% |
875% |
1029% |
1102% |
Change in Consumer Prices |
100% |
365% |
468% |
578% |
683% |
781% |
859% |
Source: Statistical Yearbook and Monthly Statistical Bulletins; Ministry of Finance – Memorandum for the Bill No. T/276
Customs Policy and Other Protective Measures
Another source of problems is the carelessly structured customs policy with duty reductions that are not compensated by other means of protection. The competitiveness of Hungarian products and services is dwindling as a result of state measures and the lack of policies to protect goods manufactured in Hungary. Import duties as a whole went down by nearly HUF 200 billion over the past four years due to reductions of duties and additional duties on selected products (see Table 16). At the same time, and partly because of lower customs duties, the volume of imports were growing at an increased pace. Lost revenues from duties were offset by imposing further taxes on the domestic industry and higher taxes levied on individuals either directly or indirectly, and through reduced social benefits. Overall competitiveness of the Hungarian economy over imports dropped by HUF 400 billion by 1998.
Table 16
State Revenues from Customs Duties; and Import Figures
billion HUF
Description |
1994 |
1995 |
1996 |
1997 |
1998 |
1999 |
Customs Revenues |
|
|
|
|
|
|
State Budget Projection |
122.5 |
221.3 modified |
246 |
196 |
104 |
|
at current prices |
148.8 |
248 |
247 |
159.9 |
104 |
91 |
of whichCustoms Deposit |
0 |
47.5 |
32.4 |
34.4 |
34 |
32 |
Additional Duties |
0 |
69 |
98.8 |
29 |
0 |
0 |
Duties and Tax |
148.8 |
131.5 |
115.8 |
96.5 |
70 |
59 |
of whichFood Industry |
|
|
|
24 |
27 |
29 |
at 1995 prices |
190 |
248 |
202 |
137 |
171 |
52 |
at 1997 prices |
279 |
436 |
301 |
196 |
93 |
74 |
at 1998 prices |
313 |
396 |
332 |
220 |
104 |
83 |
Revenues from Duties and Tax Only |
313 |
210 |
156 |
108 |
70 |
59 |
Lost Revenues |
|
|
|
|
|
|
over 1996* |
|
|
|
|
|
|
over 1997 (at 98 prices)** |
|
|
|
112 |
|
|
over 1998 (at 98 prices)** |
|
|
|
|
228 |
|
over 1999 (at 98 prices)** |
|
|
|
|
|
249 |
Total Imports*** |
1537.0 |
1936.4 |
2379 |
3170.4 |
3479 |
4125 |
of which inward processing |
197.5 |
316.7 |
436.7 |
644.3 |
806 |
947 |
Duty Revenues / Imports % |
9.68 |
12.81 |
10.38 |
5.04 |
2.99 |
2.21 |
Duty Revenues / Imports %**** |
9.68 |
6.79 |
4.87 |
3.04 |
2.01 |
1.43 |
Duty Revenues / Imports % ***** |
11.11 |
8.12 |
5.96 |
3.82 |
2.62 |
1.86 |
*Total loss of revenues on import duties.
**Loss of revenues over 1996.
*** Not including industrial free zones.
****Not including customs deposit and additional duties.
*****Not including inward processing.
Source: Historical data and projections of the 1995, 1996, 1997 and 1998 annual state budgets, and Act: CXLVI of 1997.
Available funds for protecting the national industry (not including agriculture and related industries that are protected through customs duties) amounted to HUF 43 billion in 1998 and were
projected 30 billion in 1999.
Government officials were wrong when they signed international agreements and had them ratified only on reducing customs duties, and at the same time failed to develop and implement measures conforming to WTO regulations and protecting the national economy. Existing measures are against economic interests of the country because:
It is vital that legislature devote extra time to this issue; and it is even more so, because discussions about free trade agreements and Hungary’s trade policy are already on the agenda of the Parliament.
Hungary’s future EU membership requires abolishing import quotas, which, along with lower customs duties, will boost imports.
Customs statistics for 1998 (not including free zones since they are isolated from the national economy) say the annual trade deficit amounts to USD 4.5 billion, that is higher by 1.5 billion than the year before (it was USD 3 billion in 1997). (See Table 10 for details.) Having considered adjusting factors of cross currency rate variations and energy price reductions that reduced this deficit, we can calculate a real USD 2 billion deficit. Excessive import volumes can only be prevented by the protection of the domestic production and an increased output through providing more labour. Higher supply of goods from within Hungary is the only effective way to reduce imports, through increasing labour and improving competitiveness of Hungarian products. It is not meant to say that domestic production should be granted additional subsidies; the point is that equal chances need to be given to both by eliminating the preferential treatment of imports.
The Public Procurement Act needs to be modified to give protection to domestic production and enable the development of underdeveloped regions of the country.
Protection of domestic industry and labour are important, but special attention needs to be paid to the protection of industry meeting state-of-the-art environmental requirements, such as manufacturing of EURO-II engines and buses in a plant in the West of Hungary (RÁBA) as well as domestic production of energy-saving equipment. Protection of those industries increases state revenues since it moderates the unfavourable impacts of duty reductions. Implementation of protection measures other than duties could generate further direct and indirect revenues for the state by having foreign industries to pay.
Protection of domestic production and the environment in the spirit of WTO requirements can only be achieved by properly elaborated measures. A refrigerator manufacturer in Jászberény (eastern Hungary) is an example to follow. The plant was destroyed by fire not a long time ago. The government assists in the reconstruction of the plant by implementing measures that only allow the sales of refrigerators on condition they meet environmental and energy efficiency ratios. The new plant will comply with better environmental and technical requirements. The (foreign) owners and Hungary will both benefit from the reconstruction. It is also needless to say that foreign refrigerator manufacturers will not be discriminated unless they fail to meet the requirements set by the government.
Hungary’s Worsening Competitive Position,
with Energy Policy in Focus
Under the agreement between the EU and Hungary, and other related commitments adopted by Hungary (such as WTO), customs tariffs and duties (including additional duties on selected products and other revenues from imports) have changed and will change as follows:
The already troublesome situation of the state budget and Hungary’s competitiveness will be aggravated by changes in the energy sector, whereas constraints will grow:
Prices of energy saw a considerable drop in 1998 and in 1999 all over the world. So did the costs of energy import for Hungary: they went down by USD 500 million in 1998. However, low prices will not last forever, and as soon as prices start to move in the other direction, the above impacts of the energy sector on the state budget will be much stronger.
Producer prices of electricity and natural gas went down in real terms whereas costs of purchasing energy supplies moved up. The imbalance between the prices could be removed by incorporating energy taxes and environmental load fees into energy prices for industrial users. Tax revenues then could be used for restructuring the industry to reduce and, later on, eliminate inflationary impacts of the price rise. Restructuring and development alone could reduce the demand for energy, which prevents further increase of prices. Besides, costly investments in energy production could be avoided this way, which would also help reduce inflation. Pushing down external costs is also a means of long-term price reduction.
Table 17
State Budget Balance
million HUF
REVENUES |
1994 |
1995 |
1996 |
1997 |
1998 |
1999 |
REVENUES FROM BUSINESS ENTERPRISES |
|
|
|
|
|
|
Corporate Tax (not including financial institutions) |
75,978 |
90,991 |
110,876 |
144,716 |
205,000 |
260,400 |
Mining Taxes |
17,741 |
31,892 |
16,743 |
18,053 |
15,599 |
16,380 |
Duties and Import Taxes |
148,796 |
247,885 |
247,171 |
196,000 |
117,000 |
134,300 |
Share on State Property |
-1,126 |
|
|
|
|
|
Gambling Taxes |
4,266 |
5,301 |
9,088 |
11,100 |
12,800 |
21,400 |
Other Revenues |
12,300 |
8,901 |
15,142 |
25,700 |
20,000 |
35,000 |
TOTAL |
257,955 |
384,970 |
399,020 |
395,569 |
370,399 |
467,480 |
TAXES ON CONSUMPTION |
|
|
|
|
|
|
Value Added Tax |
336,371 |
423,954 |
515,080 |
627,000 |
714,000 |
985,000 |
Consumer Tax / Excise Duties |
164,271 |
200,940 |
222,116 |
266,300 |
306,000 |
460,900 |
TOTAL |
500,643 |
624,894 |
737,196 |
893,300 |
1,020,000 |
1,445,900 |
REVENUES FROM INDIVIDUAL S |
|
|
|
|
|
|
Gross Revenues from Personal Income Tax |
305,000 |
383,700 |
490,666 |
536,500 |
596,000 |
660,000 |
State Budget Share of Personal Income Tax |
243,478 |
290,113 |
389,392 |
400,848 |
416,000 |
531,536 |
Other Taxes |
3,526 |
3,036 |
4,080 |
3,250 |
3,200 |
4,500 |
Other Duties |
16,394 |
20,971 |
26,191 |
29,900 |
34,500 |
42,423 |
TOTAL |
263,397 |
314,120 |
419,663 |
433,998 |
453,700 |
578,459 |
REVENUES FROM CENTRAL BUDGET |
|
|
|
|
|
|
INSTITUTIONS |
4,617 |
11,539 |
9,123 |
4,900 |
4,500 |
12,130 |
Own Revenues of Government Institutions |
274,328 |
243,092 |
245,102 |
193,249 |
212,592 |
341,436 |
Revenues from Support Schemes |
|
|
32,764 |
16,257 |
13,163 |
64,888 |
Revenues Credited on Residual Accounts |
|
|
|
|
|
|
TOTAL |
274,328 |
243,092 |
277,866 |
209,506 |
225,755 |
406,323 |
PAYMENTS BY LOCAL GOVERNMENTS |
839 |
975 |
2,891 |
3,600 |
2,800 |
4,000 |
REVENUES FROM EXTRABUDGETARY STATE FUNDS |
5,300 |
234 |
4,700 |
5,600 |
8,150 |
9,990 |
PAYMENTS BY INTEGRATED FUNDS |
|
|
|
|
|
|
INTERNATIONAL FINANCIAL TRANSACTIONS |
11,604 |
3,601 |
14,957 |
27,651 |
14,677 |
|
CONTRIBUTION OF TREASURY |
|
|
|
|
15,663 |
16,855 |
CORPORATE TAX FROM FINANCIAL INSTITUTIONS |
7,548 |
12,985 |
16,038 |
17,500 |
19,140 |
34,500 |
OTHER REVENUES |
2,316 |
3,358 |
25,545 |
4,184 |
2,550 |
11,450 |
DEBT SERVICE REVENUES |
62,760 |
43,713 |
44,378 |
35,076 |
18,763 |
97,374 |
|
|
|
|
|
|
|
TOTAL REVENUES |
1,391,305 |
1,643,480 |
1,968,769 |
2,043,008 |
2,156,098 |
3,084,461 |
|
|
|
|
|
|
|
TOTAL REVENUES |
1,391,305 |
1,643,480 |
1,968,769 |
2,043,008 |
2,156,098 |
3,084,461 |
TOTAL EXPENSES |
1,407,767 |
1,484,101 |
1,602,977 |
1,718,231 |
1,828,643 |
2,615,479 |
PRIMARY BALANCE |
-16,461 |
159,379 |
365,793 |
324,777 |
327,455 |
468,982 |
Primary Balance in Terms of GDP (%) |
-0,4 |
2,9 |
5,5 |
3,8 |
3,3 |
4,0 |
|
|
|
|
|
|
|
NATIONAL BANK REVENUES |
22,900 |
2,300 |
5,210 |
55,700 |
72,600 |
44,000 |
INTERNATIONAL INTEREST REVENUES |
2,149 |
3,796 |
5,600 |
4,844 |
4,469 |
|
DOMESTIC INTEREST REVENUES |
1,950 |
11,670 |
94,491 |
123,060 |
47,204 |
|
PRIVATISATION REVENUES |
31,000 |
150,000 |
211,880 |
50,000 |
10,000 |
8,000 |
TOTAL REVENUES |
1,449,304 |
1,811,247 |
2,285,950 |
2,276,612 |
2,290,371 |
3,136,461 |
GRANDTOTAL REVENUES |
1,449,304 |
1,811,247 |
2,285,950 |
2,276,612 |
2,290,371 |
3,136,461 |
GRANDTOTAL EXPENSES |
1,695,481 |
1,968,375 |
2,206,508 |
2,561,607 |
2,568,025 |
3,510,634 |
STATE BUDGET BALANCE |
-246,177 |
-157,129 |
79,442 |
-284,995 |
-277,654 |
-374,173 |
Table 17 (continued)
EXPENSES |
1994 |
1995 |
1996 |
1997 |
1998 |
1999 |
SUBSIDIES TO BUSINESS ENTERPRISES |
|
|
|
|
|
|
Production Subsidies |
37,183 |
28,310 |
41,137 |
47,080 |
52,560 |
60,000 |
Other Subsidies |
2,295 |
1,516 |
572 |
1,100 |
1,000 |
500 |
Subtotal |
39,478 |
29,826 |
41,709 |
48,180 |
53,560 |
60,500 |
Subsidies to National Public Broadcasting |
|
|
|
|
|
10,595 |
Market Access Subsidies |
46,732 |
47,531 |
45,079 |
42,300 |
42,500 |
49,800 |
Reorganisation Schemes |
4,979 |
7,453 |
10,878 |
0 |
3,000 |
|
Agricultural Production Subsidies |
9,909 |
11,620 |
16,388 |
21,180 |
24,600 |
48,345 |
Subtotal |
61,620 |
66,604 |
72,345 |
63,480 |
70,100 |
98,145 |
TOTAL |
101,098 |
96,431 |
114,054 |
111,660 |
123,660 |
169,240 |
SUBSIDIES ON FINAL CONSUMPTION |
27,047 |
32,505 |
44,949 |
50,000 |
58,000 |
73,600 |
CAPITAL EXPENDITURE |
|
|
|
|
|
|
Government funds for Capital Investments |
43,653 |
48,394 |
67,201 |
92,393 |
112,450 |
117,346 |
Financial Assistance for Home Construction |
29,570 |
59,853 |
51,244 |
36,640 |
42,000 |
60,000 |
TOTAL |
73,223 |
108,247 |
118,445 |
129,033 |
154,450 |
177,346 |
SOCIAL BENEFITS THROUGH SOCIAL SECURITY FUNDS |
|
|
|
|
|
|
Family Allowances and Subsidies |
144,900 |
137,892 |
132,100 |
134,300 |
144,100 |
191,800 |
Social Benefits |
41,156 |
45,718 |
56,909 |
55,700 |
53,180 |
75,130 |
Other Allowances and Subsidies |
23,966 |
21,312 |
24,076 |
17,000 |
18,800 |
16,890 |
TOTAL |
210,022 |
204,922 |
213,085 |
207,000 |
216,080 |
283,820 |
GOVERNMENT INSTITUTIONS |
|
|
|
|
|
|
Subsidies to Government Institutions |
347,260 |
373,205 |
416,965 |
509,318 |
536,932 |
815,203 |
Subsidies to programs |
|
|
16,540 |
44,518 |
62,427 |
154,217 |
Subtotal |
347,260 |
373,205 |
433,506 |
553,836 |
599,359 |
969,420 |
Expenditures of the Government Institutions Financed by Own Income |
252,533 |
222,910 |
245,102 |
193,249 |
212,592 |
341,436 |
Expenses of the Programs Financed by Own Income |
|
|
37,764 |
16,257 |
13,163 |
64,888 |
Subsidies Funded by Last Year’s Provisions |
12,843 |
16,551 |
|
|
|
|
TOTAL |
612,636 |
612,666 |
716,372 |
763,342 |
825,114 |
1,375,743 |
SUBSIDIES TO CIVIL MOVEMENTS |
2,582 |
2,704 |
4,996 |
3,394 |
3,237 |
2,954 |
SUBSIDIES TO LOCAL GOVERNMENTS |
|
|
|
|
|
|
Direct Budgetary Subsidies |
298,624 |
320,200 |
327,014 |
361,843 |
351,200 |
440,487 |
Transfer of Personal Income Tax Revenues |
61,298 |
93,631 |
101,274 |
135,652 |
180,000 |
|
TOTAL |
359,922 |
413,831 |
428,288 |
497,495 |
531,200 |
|
SUBSIDIES TO EXTRABUDGETARY FUNDS |
37,410 |
31,674 |
4,385 |
150 |
0 |
70 |
EXPENSES OF INTERNATIONAL FINANCIAL TRANSACTIONS |
17,992 |
28,540 |
14,703 |
22,594 |
37,257 |
19,795 |
DEBT SERVICE |
8,020 |
25,553 |
21,250 |
10,182 |
10,946 |
|
OTHER EXPENSES |
3,676 |
4,102 |
4,921 |
7,754 |
8,700 |
6,425 |
GENERAL RESERVES |
0 |
0 |
|
12,850 |
|
19,000 |
PROVISIONS |
|
|
|
2,050 |
|
2,500 |
EXTRAORDINARY EXPENSES |
4,176 |
10,978 |
21,343 |
21,379 |
23,000 |
23,000 |
CALLED STATE GUARANTEES |
11,263 |
5,581 |
-2,539 |
15,000 |
17,000 |
21,500 |
|
|
|
|
|
|
|
TOTAL EXPENSES |
1,407,767 |
1,484,101 |
1,602,977 |
1,718,231 |
1,828,643 |
2,615,479 |
|
|
|
|
|
|
|
SETTLEMENT OF NATIONAL BANK LOSSES |
|
|
58,100 |
|
|
|
INTERNATIONAL INTEREST PAYMENTS |
3,590 |
6,904 |
10,400 |
25,885 |
20,920 |
|
DEBT SERVICE INTEREST PAYMENTS |
284,124 |
477,370 |
535,031 |
817,492 |
718,462 |
768,664 |
STATE GUARANTEES AND CONTRIBUTION TO SOCIAL SECURITY FUNDS |
|
|
|
|
|
126491 |
GRANDTOTAL EXPENSES |
1,695,481 |
1,968,375 |
2,206,508 |
2,561,607 |
2,568,025 |
3,510,634 |
It is important to note that the relatively low prices of energy today open up the opportunity to introduce energy taxes. The earlier they are imposed, the less difficulties they cause.
If introduced, energy taxes would be beneficial for both the EU and Hungary. Countries rich in energy sources may expect less profits from sales, so both the EU and Hungary will be advantaged over those countries in the course of international redistribution of resources.
Table 17 is a summary of state budget items. We have rearranged the data so that they could be comparable over the period between 1994 and 1999.